Pathology Analytics
Product Summary
The Pathology Analytics products will consist of interactive dashboards and data investigation tools which will consolidate data from various data sources - Epic, Cerner, lab-specific middleware - that are part of the lab specimen processing and store them in HANA.
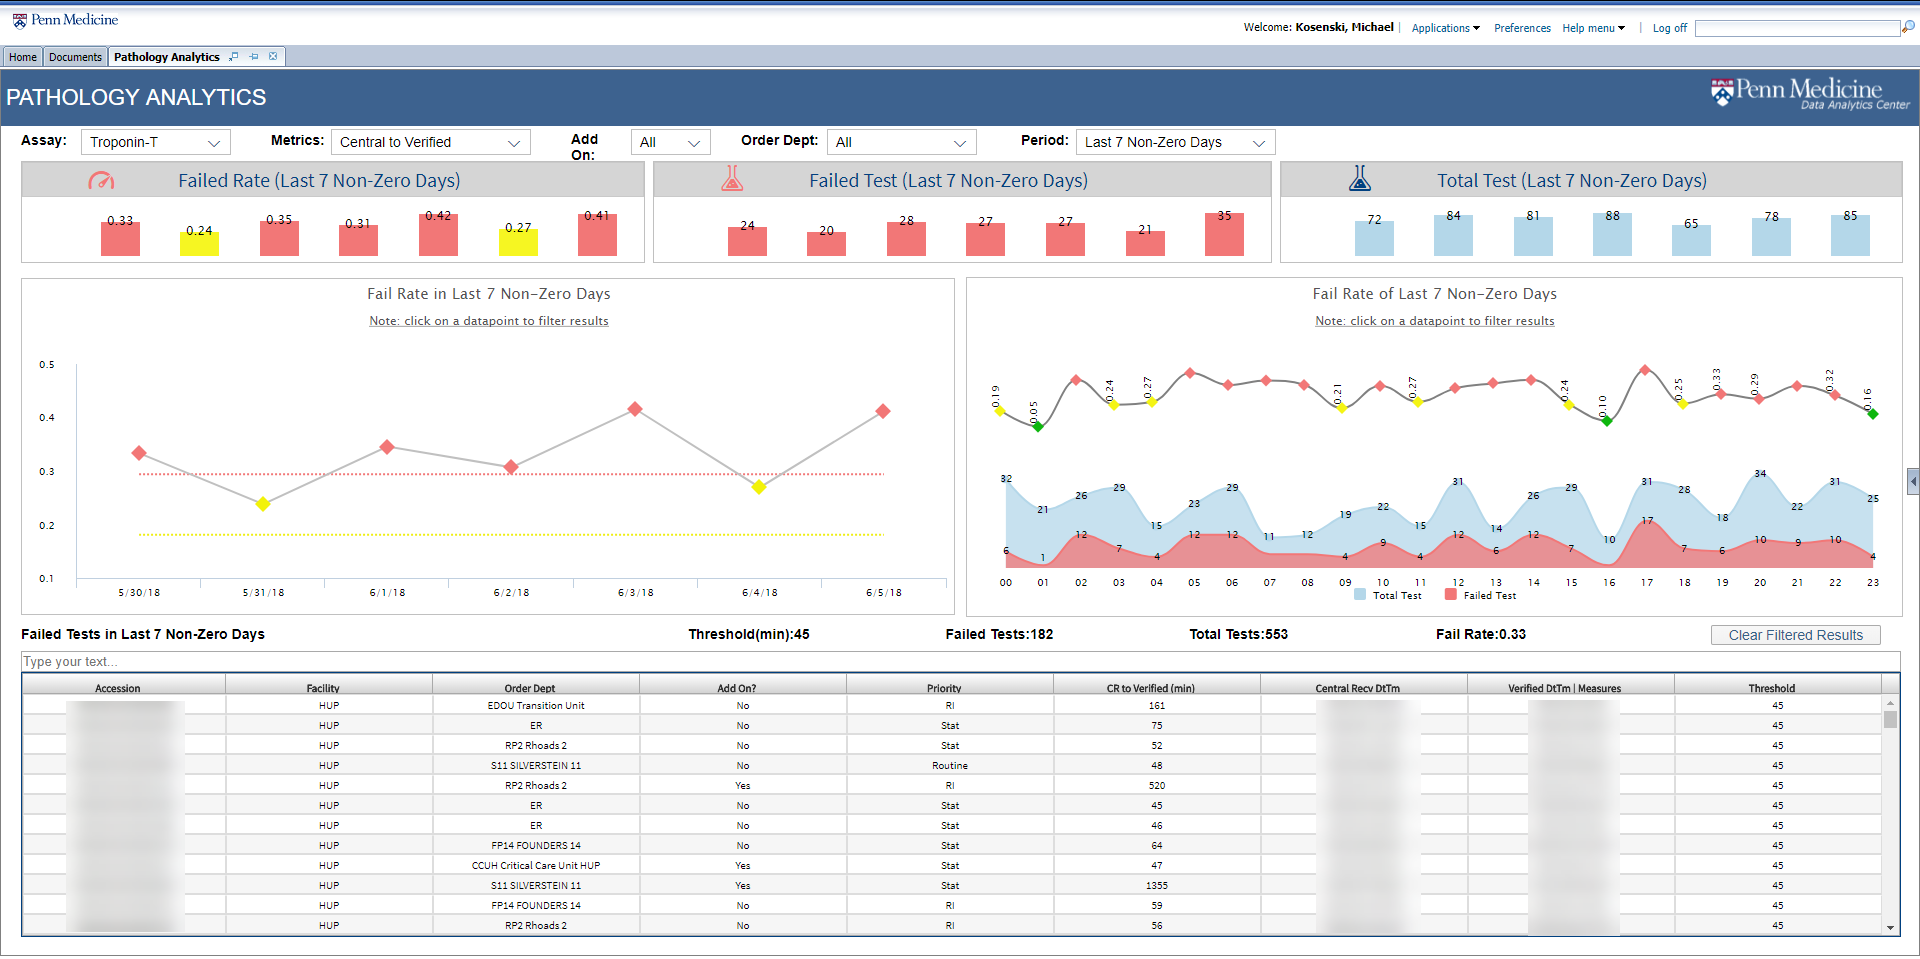
The dashboards will provide metrics to track various metrics at various stages of the assay processing, from the initial order to the final results. Results will be displayed filterable charts for month/week/day levels and will show results for each of those time-frames, as well as per-hour values. The initial version will focus on Troponin assay tests performed by the HUP lab for orders generated in the HUP ED.
Additionally there will be data investigation tools for tracking laboratory test utilization, such as aggregating data about specimens sent to laboratories outside of UPHS, for analysis of performance tracking, including unnecessary sendouts, ordered by, patient type, frequency, and variability between practices and practitioners.
Intended Purpose
Both clinical and operational staff will access the dashboards and tools and use them for analysis and investigation to find ways to improve workflows, look for resource deficiencies, and identify areas of concern such as over/under testing, unnecessary send-outs, equipment/personnel bottlenecks, and lag in process or equipment.
Pathology Analytics Knowledge Base
Dashboard Image