Laboratory for Individualized Breast Radiodensity Assessment
The Laboratory for Individualized Breast Radiodensity Assessment (LIBRA), a software package developed by the Computational Breast Imaging Group (CBIG) at the University of Pennsylvania, is a fully-automatic breast density estimation software solution based on a published algorithm that works on either raw (i.e., “FOR PROCESSING”) or vendor post-processed (i.e., “FOR PRESENTATION”) digital mammography images from two vendors: GE Healthcare and Hologic. Based on an algorithm published in Medical Physics, LIBRA has been applied to over 30,000 screening exams and is being increasingly utilized in larger studies.
LIBRA has two modes of operations:
- An easy-to-use interactive mode with Graphical-User-Interface where the user is prompted to select either a single DICOM image or a folder of DICOM images, an output folder for the results, and whether they wish to save intermediate files.
- A command-line interface amenable to batch processing and scripting, where the user can explicitly define the input and output paths.
About the Algorithm


The amount of fibroglandular tissue content in the breast as estimated mammographically, commonly referred to as breast percent density (PD%), is one of the most significant risk factors for developing breast cancer. Approaches to quantify breast density commonly focus on either semiautomated methods or visual assessment, both of which are highly subjective. This software package was developed to be a fully-automated density estimation method that works on both raw (i.e., “FOR PROCESSING”) and vendor postprocessed (i.e., “FOR PRESENTATION”) digital mammography images,and has thus far been validated to work on GE Healthcare and Hologic digital mammography systems [*].
Briefly, the software first applies an edge-detection algorithm to delineate the boundary of the breast and the boundary of the pectoral muscle. Following the segmentation of the breast, an adaptive multi-class fuzzy c-means algorithm is applied to identify and partition the mammographic breast tissue area, into multiple regions (i.e., clusters) of similar intensity. These clusters are then aggregated by a support-vector machine classifier to a final dense tissue area, segmentation. The ratio of the segmented absolute dense area to the total breast area is then used to obtain a measure of breast percent density (PD%).
The software generates both quantitative estimates of breast area, dense area and PD% that are stored in a comma separated text file (.csv, openable by Excel) as well as a .JPG image of the breast and density segmentations overlaid on a window-levelled version of the mammogram amenable for publication to a user-defined directory, in addition to several optional files, as described in the Manual Section.
*DISCLAIMER: Density estimation on mammograms from other vendors has not been validated, therefore the performance and the quality of segmentation is not guaranteed. However the breast segmentation algorithm within LIBRA generally works well across all vendors and thus may be of general use in a research context.
Close
Download
Software License
The LIBRA software is freely available under a BSD-style open source license that is compatible with the Open Source Definition by The Open Source Initiative and contains no restrictions on use of the software. The full license text is included with the distribution package and available online.
Documentation
LIBRA Manual: PDF version of software manual.
Installation
The LIBRA software package is primarily distributed as a pre-compiled, stand-alone executable to ensure platform-wide compatibility; the MATLAB source files are also provided for development purposes. Currently, the stand-alone version of LIBRA is available for 64-bit versions of Windows, with solutions for Linux and Mac OS being actively worked on. Running the stand-alone version will require downloading and installing MATLAB Compiler Runtime version R2013A (8.1), available for download at MathWorks, Inc. at the link below. Using the MATLAB source files (for any Operating System) will require MATLAB main license and access to certain toolboxes, listed below with links to the MathWorks, Inc. product pages describing them.
Prerequisites - Stand-alone executable
Operating System Requirements
Windows 7, 64-bit. Note: other 64-bit versions of Windows (i.e., XP, Vista and 8) may also be compatible, but have not been thoroughly evaluated at this time.
| Dependency | Release | Description |
| MCR (Version 8.1) | R2013A 64-bit | MATLAB Compiler Runtime enables program to run without MATLAB installed. |
Prerequisites - MATLAB source files
Operating System Requirements
Windows 32-bit/64-bit, Mac OS 32-bit/64-bit, Linux 32-bit/64-bit
MATLAB Version Requirements
MATLAB 2012A, 2012B, 2013A, 2014A, and 2014B 32-bit/64-bit. Note: other versions of MATLAB may be compatible, but have not been thoroughly evaluated at this time. CAUTION: There is a known bug and incompatibility to MATLAB R2013b (version: 8.2.0.705) on Windows that the dicomread.m function would randomly crash and terminate the matlab routine.
| Dependency | Description |
| Curve Fitting Toolbox | MathWorks, Inc. MATLAB Curve Fitting Toolbox |
| Image Processing Toolbox | MathWorks, Inc. MATLAB Image Processing Toolbox |
| Signal Processing Toolbox | MathWorks, Inc. MATLAB Signal Processing Toolbox |
| Statistics Toolbox | MathWorks, Inc. MATLAB Statistics Toolbox |
| Symbolic Math Toolbox | MathWorks, Inc. MATLAB Symbolic Math Toolbox |
To Download please visit our LIBRA NITRC page
Close
Manual
Table Of Contents
Manual
LIBRA Manual: PDF version of this software manual.
Running the Software - Interactive Mode
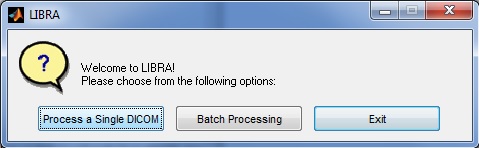
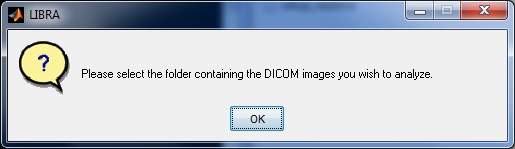
When running LIBRA in interactive mode (i.e., by double-clicking the .exe file) the user is first prompted as to whether they would like to analyze a single DICOM image, batch process all DICOM images in a specific folder, or exit out of the software. Details on the specific options are provided below.
Interactive Mode - Single Image
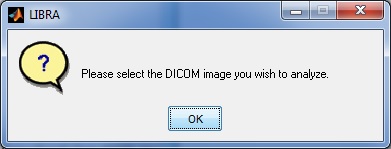
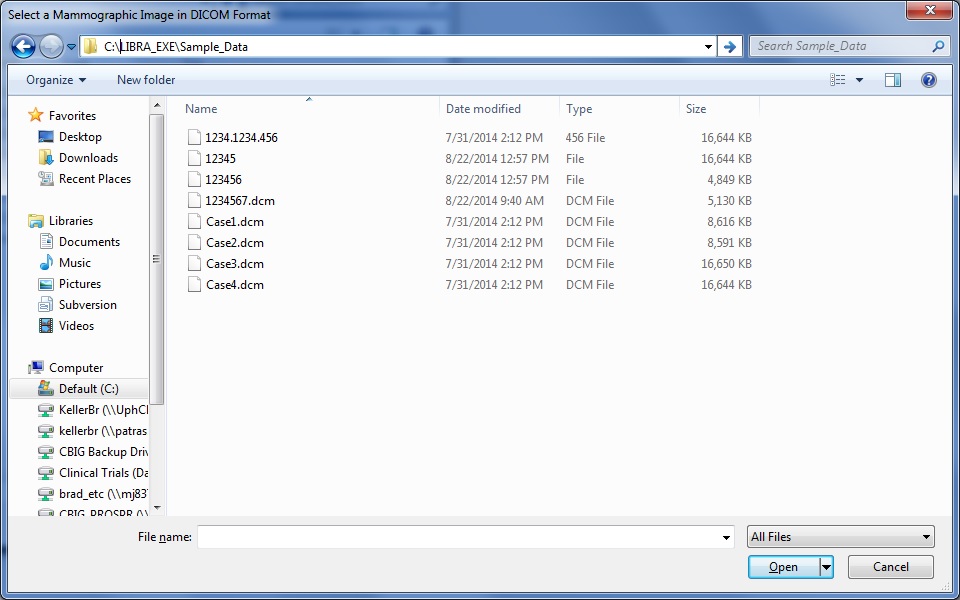
If the user chooses to analyze a single DICOM image, they are first prompted to select a DICOM image to analyze via a standard dialogue prompt.
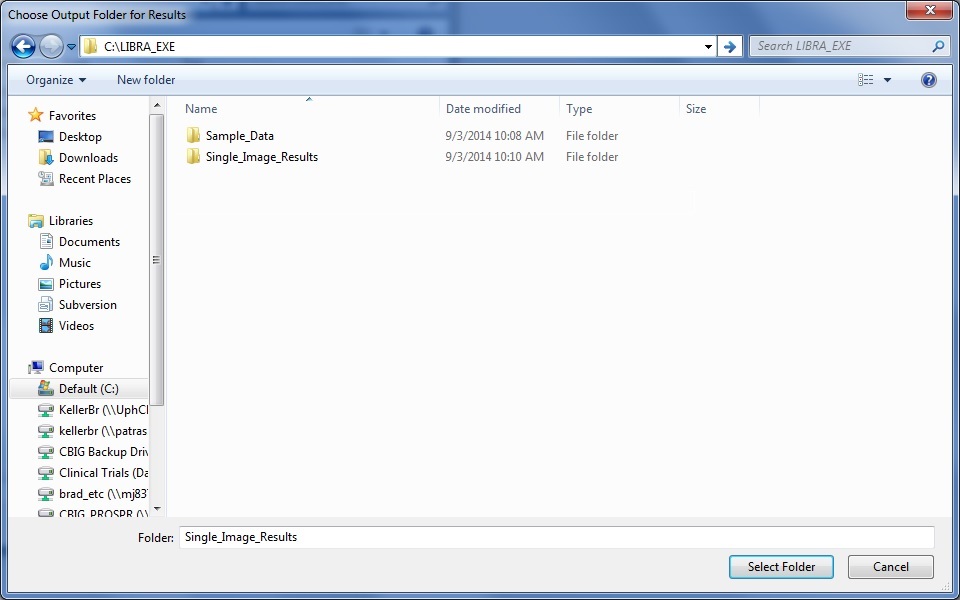
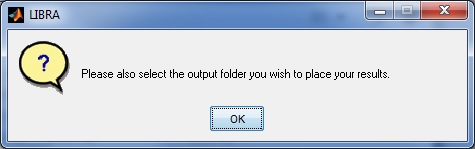
Second, the user is then prompted to select an output folder where the density scores and density segmentation image .jpg file will be stored. Note: If the folder already exists and contains density estimates (e.g., from a previous run of LIBRA.exe), it will append the new results to the results file.

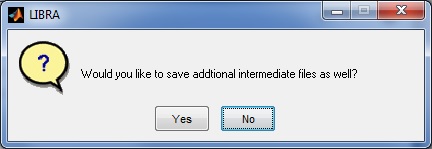
Lastly, the user will be asked whether they wish to store a processing log file and intermediate graphics in addition to the density segmentation outline which may be on interest for publication or visualization purposes, and are further described in the Outputs section below.

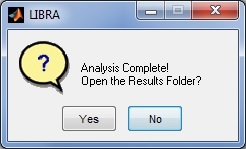
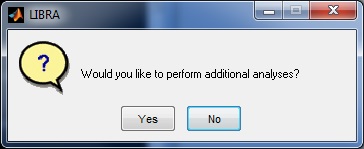
LIBRA will then begin processing the image; the progress of the software can be monitored via the related command-prompt window that opens when LIBRA.exe is run. The average runtime for most images is 6-10 seconds. When analysis is complete, a prompt appears asking the user if they want to open the results folder and if they want to perform additional analyses.

Interactive Mode - Batch Process Folder
If the user chooses to perform a batch analysis of all the DICOM images within a folder, they are first prompted to select the folder to analyze via a standard dialogue prompt.
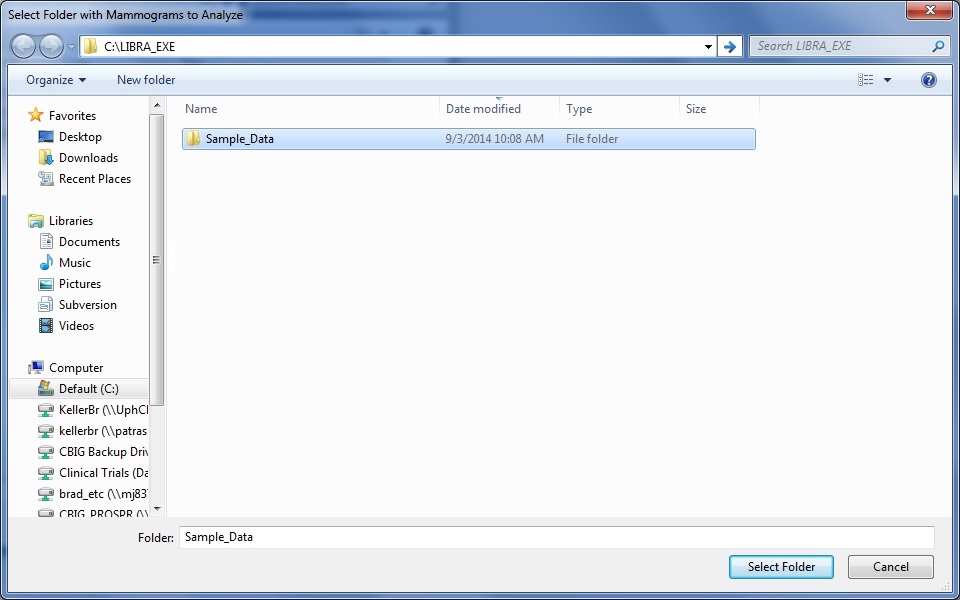
Second, the user is then prompted to select an output folder where the density scores and density segmentation images .jpg files will be stored. Note: If the folder already exists and contains density estimates (e.g., from a previous run of LIBRA.exe), it will append the new results to the results file.
Lastly, the user will be asked whether they wish to store a processing log file intermediate graphics in addition to the density segmentation outline which may be on interest for publication or visualization purposes, and are further described in the Outputs section below.
LIBRA will then begin processing all the DICOM images; the progress of the software can be monitored via the related command-prompt window that opens when LIBRA.exe is run. The average runtime for most images is 6-10 seconds. When analysis is complete, a prompt appears asking the user if they want to open the results folder and if they want to perform additional analyses.

Running the Software - Command Line Mode
The command-line interface of LIBRA was designed to amenable to batch processing and scripting, so that the user can explicitly define the input and output paths to the files and folders to be analyzed. To run libra.exe via the command-line, two input arguments are required along with a third, optional argument. The software will then run non-interactively and process the single file specified (or all files under the directory provided) by <input>, saving the results to the specified output folder <outDir>. The arguments are:
input <char> Absolute path to the dicom file or directory containing dicom images (Optional)
outDir <char> Absolute path to the output directory (Required if <input> is specified)
saveIntermediate <bool> Boolean value to save the intermediate output (1) or not (0) (Optional; If not specified, default: 0, intermediate files are not saved)
An example command-line would take the form of: libra.exe <input> <outDir> <saveIntermediate>
Note: As in interactive mode, if the output folder already exists and contains density estimates (e.g., from a previous run of LIBRA.exe), it will append the new results to the results file. The interactive-mode interface can also be called via the command-line when no arguments are passed to libra.exe. This would be equivalent to double-clicking the libra.exe file.
LIBRA Outputs
The LIBRA software generates several forms of output all stored in the output directory specified by the user, including tables containing the density estimates, log-files of the session, and figures for presentation and review. The following outputs are always generated by the software:
Masks_<Image-Analyzed>.mat: A MATLAB datafile containing a structure array that stores the breast area (res.BreastArea), dense area (res.DenseArea), and area percent density estimates (res.PD_SVM) for the DICOM mammography file analyzed (res.dcm_fname). This structure array also stores the binary masks of the breast (res.BreastMask) and dense tissue segmentations (res.DenseMask), which may be useful for further processing and analysis.
Density.csv: A comma separated file (open-able by spreadsheet programs like Excel) that stores the breast area, dense area, and percent density estimates for each mammogram analyzed, listed by file name. The Manufacturer, Laterality and View-Position of the mammogram are also provided for reference.
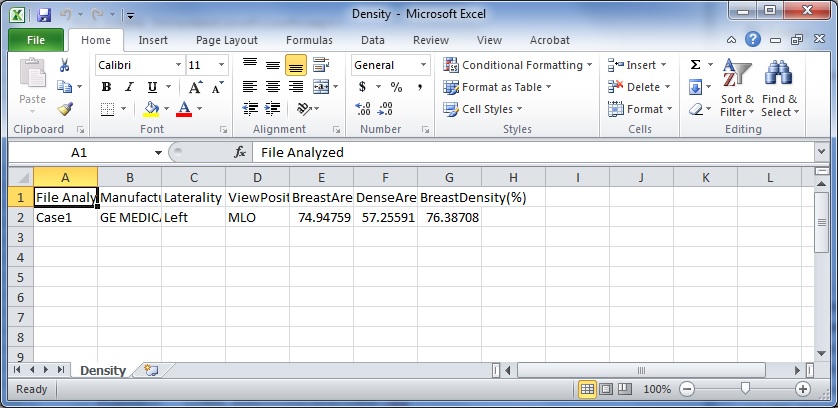
Density.csv
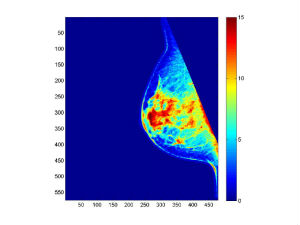
<Image-Analyzed-Filename>_density_segmentation.jpg: In the Result_Images sub-directory, the breast and density segmentation results are provided for each image analyzed. The breast is outlined in red, the density segmentation is in green. Note that for visualization purposes, the image is window-leveled to between the 5th and 95th percentile of the intensity values of the pixels within the breast region.
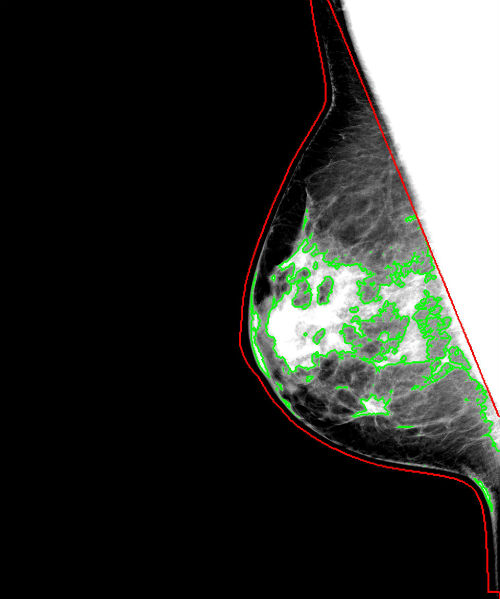
<Image-Analyzed-Filename>_density_segmentation.jpg
The following outputs are only generated by the software if the user specifies to save intermediate files:
LIBRA-logfile_<time-stamp>.txt: A log of the programs outputs during the session, this text file is time-stamped at the start of the LIBRA sessions so that multiple sessions writing to the same output folder each have their own unique log of events. The <time-stamp> takes the form of <Month>-<DD>-<YYYY>_HH-MM-SS, in 24-hour format. .. _fig_log_file:
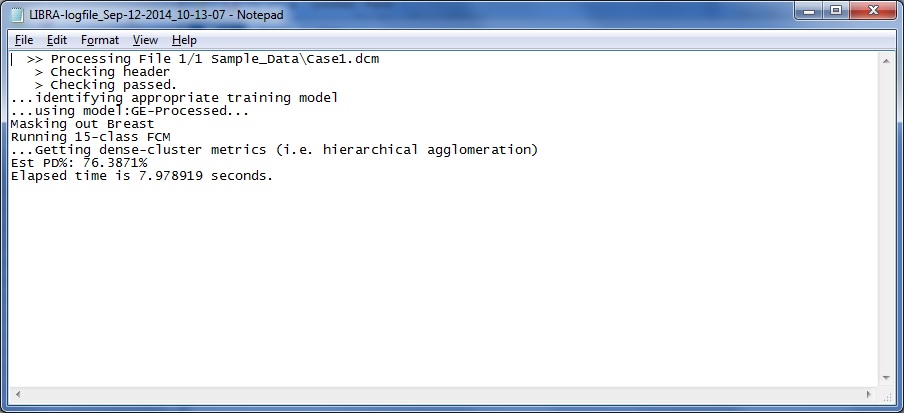
LIBRA-logfile_<time-stamp>.txt
<Image-Analyzed-Filename>_Windowed_Original.jpg: In the Result_Images sub-directory, the analyzed image window-leveled to between the 5th and 95th percentile of the intensity values of the pixels within the breast region is also provided with out the breast density segmentation overlay for comparison purposes.
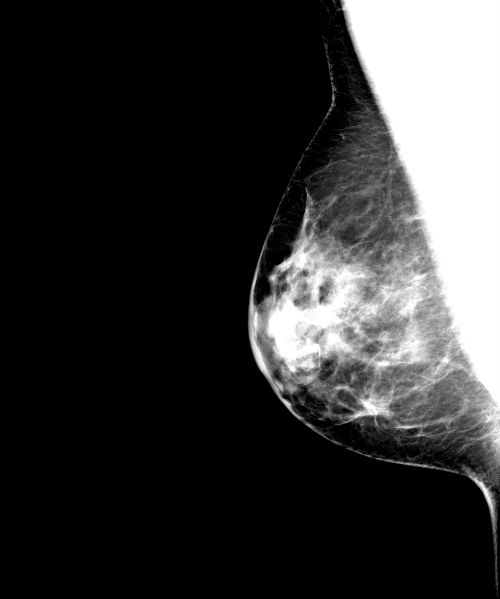
<Image-Analyzed-Filename>_Windowed_Original.jpg
<Image-Analyzed>_density_imagesc.jpg: In the Result_Images sub-directory, the image clusters (grouped by colors) generated by the Fuzzy C-Means stage of the LIBRA algorithm is provided.

<Image-Analyzed>_density_imagesc.jpg
<Image-Analyzed>_intensity_histogram.jpg: In the Result_Images sub-directory, the breast intensity histogram (z-scored) and FCM-cluster centers are plotted in this image.
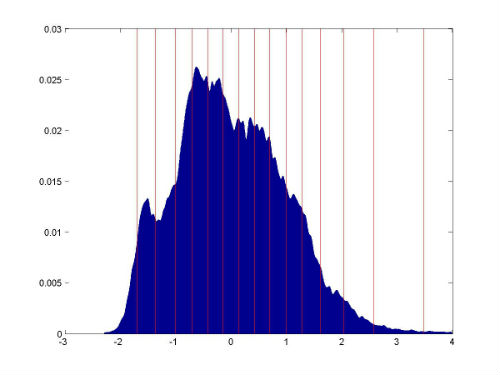
<Image-Analyzed>_intensity_histogram.jpg
Running the Software - Using the Source code
Source Package Overview
The package contains:
Source/
|---> Code/               # Main source codes
| |-> libra.m
| |-> libra_exper.m
| |-> libra_run.m
| |-> libra_version.m
| `-> private/
|
|---> Model/              # SVM models used by libra.m
| |-> GE_Processed_SVM.mat
| |-> GE_Raw_SVM.mat
| |-> Hologic_Processed_SVM.mat
| `-> Hologic_Raw_SVM.mat
|
|---> libra_demo.m        # Demo/testing program
|---> libra_startup.m     # Libra start up command
`---> libra_compile.m     # Function to comiple source code into an executable

Sample_Data/              # Data used in libra_demo.m
|-> Case1.dcm
|-> Case2.dcm
|-> Case3.dcm
|-> Case4.dcm
|-> Case5.dcm
`-> ground_truth.mat

Executable/
  `->libra(.exe)       # Pre-compiled standalone executable
                       # (Windows platform extension in parentheses.)

AUTHORS.txt                # A list of the people who contributed to this software.
COPYING.txt                # The copyright and license notices.
ChangeLog.txt              # History and evolution of the software
README.txt                 # This readme file.
LIBRA_Software_Manual.pdf  # Software manual

doc/ # Documentation files for the software pacakge (For Developer)
The Source/Code/ and Source/Code/private/ directories include all the core functions written in MATLAB. The models in Source/Model/ that are vendor-specific are GE_Processed_SVM.mat, GE_Raw_SVM.mat, Hologic_Processed_SVM.mat and Hologic_Raw_SVM.mat. Note: If a mammogram being analyzed is derived from a vendor for which no training currently exists (or the vendor is unknown), the system defaults to using Hologic-trained models. If the presentation intent type (i.e., ‘For Processing’ or ‘For Presentation’) is not defined in the DICOM header, the system defaults to using ‘For Presentation’ training. It is also worth noting that although training has only currently been completed for GE Healthcare and Hologic systems, Siemens ‘For Processing’ mammograms has also been evaluated with the system and have been found to have an acceptable level of performance.
Source/Code/libra.m is a wrapper script that performs density estimation 1) directly on one given mammogram or 2) loops through (NOT recursively) a given input directory to find out all the image to be processed. libra will output the result in a given output directory with a Density.csv and a sub-directory Result_Images/ containing final segmentation and breast mask (optional.) There are two modes: interactive mode with GUI and batch processing mode at command-line.
Source/Code/libra_exper.m is the main code that executes the breast density estimation pipeline given one input DICOM image and one output directory and the output text file.
Sample_Data/ contains sample images and testing ground truth for the sample script libra_demo.m.
doc/ contains Sphinx compatible documentation rst files that can be used to automatically generate website and pdf documentation. It is reserved for developers.
Usage
The following sections are served as a guideline for users intending to use the LIBRA package from the Source code. Please be advised to follow the instruction and execute the commands in MATLAB environment. For the instruciton on Graphical-User-Interface mode, please check out the section “Running the Software - Interactive Mode ” in LIBRA_Software_Manual.pdf.
In Matlab environment, run:
>> libra_startup
to initialize the environment for the software.
To run breast density estimation, run:
>> RESULTS = libra(PATH_INPUT, PATH_OUTPUT_DIR, SAVE_INTERMEDIATES);
where PATH_INPUT should be a mammogram with dcm as file extension or a directory containing dicom images (*.dcm) to be processed. PATH_OUTPUT_DIR is a path to the output directory. For example,
in Windows:
>> RESULTS = libra('D:\LIBRA\Sample_Data\Case1.dcm', 'D:\LIBRA\Result\', 1);
or in Linux:
>> RESULTS = libra('/path/to/LIBRA/Sample_Data/Case1.dcm', '/path/to/LIBRA/Result/', 1);
Program returns a cell array RESULTS that has Filename, BreastArea(sqcm), DenseArea(sqcm), and BreastDensity(%) as four columns, as below:
RESULTS =
'File Analyzed'  'BreastArea(sqcm)'  'DenseArea(sqcm)'  'BreastDensity(%)'
'Case3'          [        142.1792]  [        31.4047]  [         22.0881]
You can expect the outputs to be:
PATH_OUTPUT_DIR/

        |-> Result_Images/
        |       |-> Masks_<PREFIX>.mat
        |       |-> <PREFIX>_density_segmentation.jpg
        |       |-> <PREFIX>_Windowed_Original.jpg (optional)
        |       `-> <PREFIX>_density_imagesc.jpg (optional)
        |-> Density.csv
        `-> SkippedImg.csv (if any failed)
Optional outputs can be saved by setting a boolean variable SAVE_INTERMEDIATES to TRUE (or 1.) By default, these optional files are not saved.
Output segmentation images will be generated in PATH_OUTPUT_DIR/Result_Images/ while the estimated density number will be written in comma separated file, Density.csv, and failure information, if any, due to lack of required imaging information in the dicom header to be used in the classification will be written into SkippedImg.csv in PATH_OUTPUT_DIR. You can find the breast mask and the estimated values in Masks_*.mat file.
By doing:
>> help libra
you will get a full description and usage of the program.
Testing
To test the package with the sample data to see if the package runs correctly on your machine, please change the directory to the Source/ directory, simply run the following commands in MATLAB environment:
>> libra_startup
>> libra_demo
Output directories “Demo_Test” and “Demo_Test_Batch” will be created inside the source package. For more information on the output results please refer to the USAGE section.
The demo not only demonstrates breast and dense tissue segmentations but also tests whether your computing environment produces comparable results against precomputed “ground truth”. You may find the ground truth in Sample_Data/ground_truth.mat and manually compare the numbers with the results in Demo_Test/Density.csv:
>> load ground_truth.mat
>> whos
  Name      Size   Bytes   Class     Attributes
  truth     4x3    96      double
>> truth
truth =

   70.6779   52.8680     74.7996    % Ground truth for Case1.dcm
  165.6580   12.8664     7.7645     % Case2.dcm
  143.0126   32.2381     22.5421    % Case3.dcm
   92.6134   21.0520     22.7311    % Case4.dcm
   80.3807   26.1074     32.4397    % Case5.dcm
Each row contains three numbers. They are BreastArea(sqcm), DenseArea(sqcm), and BreastDensity(%), respectively.
Compilation
To compile the libra.m into a executable, change the directory to the Source/ directory within the main directory of the LIBRA package and run the following command in MATLAB environment:
>> libra_compile('D:\path\to\output\executable\folder\') % In Windows
or:
>> libra_compile('/path/to/output/executable/directory/') % In Unix
A stand-alone executable libra (libra.exe in Windows) will be created in the specified directory. When libra_compile is called without an input argument, an “Executable” directory will be created in Source directory and “libra” executable will be generated there. This compilation requires MATLAB Compiler (mcc).
After compilation, you can use the stand-alone executable without matlab environment. [*]
$ libra PATH_INPUT_DIR PATH_OUTPUT_DIR
[*] Note: Matlab Compiler Runtime (MCR) is required. Download a version of MCR that corresponds to the MCC used to compile the executable from http://www.mathworks.com/products/compiler/mcr/.
Close
FAQ
What is the expected input data format?
— DICOM files, which do not necessary have extension, if any, .dcm is the most common one.
What are the DICOM requirements for analyzing mammograms using LIBRA?
— LIBRA requires the following imaging physics (dicom tag in parentheses) to accurately estimate the density:
- ViewPosition (0018,5101)
- XrayTubeCurrent (0018,1151) (if missing, LIBRA derives it from ExposureInuAs(0018,1153) and ExposureTime (0018,1150))
- ImagerPixelSpacing (0018,1164)
- BodyPartThickness (0018,11a0)
- CompressionForce (0018,11a2)
- Exposure (0018,1152)
- KVP (0018,0060)
— LIBRA also relies on the following fields to choose the best model but would use a default model if missing
- PresentationIntentType (0008,0068)
- Manufacturer (0008,0070)
What can I do if the requirements are not fully met?
— You may collect the imaging physics and fill in the fields using MATLAB, pydicom in PYTHON or dcmtk.
Is there a quick way to QC (quality control) large amount of processed data?
— We usually look at the left-right reading agreement, and raw-processed agreement to find out if there is any outlier. We sometimes see arond 0.1% to 1% of failure rates from our experience of processing more than 70,000 mammograms.
Close
Changelog
Public Release 1.0.4 (Oct 28 2016)
- Improved air threshold estimation and overall breast segmentation.
- Made the density estimation robust against markers, clips and calcifications that are of high intensity in mammograms.
Public Release 1.0.3
- Improved the training of the SVM models for GE mammograms hence more reliable density segmentation in low density breasts.
Public Release 1.0.2
- Improved stability of airtheshold estimation in breast segmentation.
- Addressed failure in breast segmentation when spacing paddles present.
- Re-implemented fuzzy-cmean clustering.
- And other bug fixes.
Public Release 1.0.1
- More robust against variations in dicom header.
- Removed age as a hard requirement of the dicom.
- And other bug fixes.
Public Release 1.0.0 (Oct 31st 2014)
- First stable public release.
- Improved the run-time speed by sub-sampling the image histogram using its CDF.
- Added regression tests in libra_demo.m and a ground truth mat file in Sample_Data/.
- Added a libra_version.m for versioning purpose.
- Added a libra_compile.m for binary compilation.
- Added a unified libra.m that works on one dicom and multiple dicoms in one input directory. (Spinned off from libra_batchProcessing.m)
- Merged the GUI into libra.m and greatly enhanced functionality and usability of the GUI.
- No longer supports output breast mask in nifti format.
- Fixed the aspect ratio of the output jpg images.
Pre-release 1.5.0:
- Updated SVM models.
- Added a GUI and files.
- Added package “dicom_readwrite” to ensure version compatibility with Matlab R2013b,
- Modified training model selection process, so that raw/processed model selection is de-coupled from the manufacturer choice selection
- Updated readme file to include biblographic information.
- Moved imaging physic checks from libra_batchProcessing to Code/libra_exper.m.
- Added a startup script.
- Removed modelDir from input argument.
Pre-release 1.4.3:
- Added package “dcm2nii” to enable nifti breast mask output,
- Added complete breast estimation numbers into output mat file,
- Added output file checking in batchProcessing script to skip those already processed images in the same output directory.
- Added an user-input option saveIntermediate to save additional figures or not,
- Enhanced laterality checking,
- Enhanced testing/demo in SCRIPT_2_Get_Breast_Density.m.
Pre-release 1.4.2:
- Added software SVN information (svn properties) to codes,
- Applied a Gaussian smoothing on the full-image histogram to be more adaptive on thresholding air-breast boundary, and increased the airthreshold cutoff to 0.05 in Code/con_breast2c.m.
- Fixed the cutting-from-the-middle problem.
Pre-release 1.4.1:
- Added a batch processing script: libra_batchProcessing.m. It loops through a folder to collect all DICOM images to process, checks if the necessary header information exist,
- Added a Readme documentation,
- Added the Sample_data for testing purpose,
- Added a sub-function to print out the imaging physics information from the DICOM header into a SkippedImg.csv for debugging purpose,
-
Fixed the Left-Right flipping bug. Now the program will determin what DICOM needs to be flipped properly. It used to flipped incorrectly the HOLOGIC images. Now the right breast will be flipped to the left and horizontal flipped left breast, which appears on the right, will be flipped as well.
Pre-release 1.4.0:
- Fixed the air-breast boundary segmentation problem,
- Added image vendor checking mechanisms to choose the right SVM model and functions to use for each image, therefore it is not necessary to choose the corresponding SVM model,
- Minor change in output text file format from tab separated to comma separated,
- Minor change in the libra_exper.m so that it can be given with any output directory and thus enhances the portability.
Close
People
Principal Investigator
- Despina Kontos, Ph.D.
Software Development
- Brad M. Keller, Ph.D.
- Michael M.K. Hsieh, M.S.
Contributors
- Diane L. Nathan, M.D.
- Emily F. Conant, M.D.
- Yan Wang, Ph.D.
- James C. Gee, Ph.D.
- Yuanjie Zheng, Ph.D.
- Said Pertuz Ph.D
Testers
- Bilwaj Gaonkar, Ph.D.
- Jia Wu, Ph.D.
- Harini Eavani, Ph.D.
- Aimilia Gastounioti, Ph.D.
- Dong Wei, Ph.D.
- Nariman Jahani, Ph.D.
Close
Publications
When publishing results or data derived from this software, please include a bibliographical reference to the 2012 Keller et al. Medical Physics paper (PubMed ID: 22894417) describing the methodology as well as to the 2015 Keller et al. Breast Cancer Research paper (PubMed ID: 26303303) evaluating the association between LIBRA breast density and breast cancer risk in a case-control study. Other studies in which LIBRA has been used are also listed in references.
| [MedPhys2012] | B.M. Keller, D.L. Nathan, Y. Wang, Y. Zheng, J.C. Gee, E.F. Conant, and D. Kontos: “Estimation of breast percent density in raw and processed full field digital mammography images via adaptive fuzzy c-means clustering and support vector machine segmentation,” Medical Physics 39 (8), 4903-4917 |
| [BCR2015] | B.M. Keller, J. Chen, D. Daye, E.F. Conant, and D. Kontos. “Preliminary evaluation of the publicly available Laboratory for Breast Radiodensity Assessment (LIBRA) software tool: comparison of fully automated area and volumetric density measures in a case–control study with digital mammography.,” Breast Cancer Research 17(1), 1-17 |
| [MICCAI2011] | B. Keller, D. Li, Y. Wan, Y. Zheng, J.C. Gee, E.C. Conant, and D. Kontos: Adaptive Multi-Cluster Fuzzy C-Means Segmentation of Breast Parenchymal Tissue in Digital Mammography. Medical Image Computing and Computer Assisted Intervention (MICCAI). Springer-Verlag, Part III, LNCS 6893: 562-569, Sept 2011 |
| [IWDM2012] | B. Keller, E. Conant, H. Oh, D. Kontos: Breast Cancer Risk Prediction via Area and Volumetric Estimates of Breast Density. Proceedings of International Workshop on Breast Imaging (IWDM), Lecture Notes in Computer Science (LNCS) A.D.A. Maidment, P.R. Bakic, S. Gavenonis (eds.). Springer-Verlag Berlin Heidelberg, 7361: 236-43, June 2012 |
| [RSNA2012] | B.M. Keller, D.Daye, J.Chen, H.Jing, E.F.Conant, D.Kontos : The Role of Volumetric and Area Density Measures in Breast Cancer Risk Assessment. the 98th Scientific Assembly and Annual Meeting of the Radiological Society of North America (RSNA) 2012, Chicago IL Nov 2012 (Oral) |
| [ACADRAD2013] | D. Daye, B.Keller, E.F.Conant, J.Chen, M.D.Schnall, A.D.A. Maidment, D.Kontos: Mammographic Parenchymal Patterns as an Imaging Marker of Endogenous Hormonal Exposure: a Preliminary Study in a High-Risk Population. Academic Radiology 20(5): 635-46, May 2013 |
| [RSNA2013] | B.M. Keller, J. Chen, Y. Wang, Y. Zheng, J.C. Gee, E.F. Conant, D. Kontos: The Complementary Roles of Breast Density and Parenchymal Texture in Breast Cancer Risk Assessment: A Case-Control Study with Digital Mammography the 99th Scientific Assembly and Annual Meeting of the Radiological Society of North America (RSNA) 2013, Chicago, IL, Dec 2013 (Oral) |
| [RSNA2014a] | B. Keller, AM. McCarthy, J. Chen, N. Bristol, M. Synnestvedt, E. Conant, D. Kontos: Associations between Body Mass Index and Breast Density: Implications for Breast Cancer Risk Assessment the 100th Scientific Assembly and Annual Meeting of the Radiological Society of North America (RSNA) 2014, Chicago, IL, Dec 2014 (accepted) |
| [RSNA2014b] | B. Keller, J. Chen, N. Bristol, MK Hsieh, S. Ray, M. Synnestvedt, E.F. Conant, D. Kontos: Feasibility of Fully-Automated Breast Density Reporting in a Large Academic Center: Prospective Data from a One-Year Screening Cohort. the 100th Scientific Assembly and Annual Meeting of the Radiological Society of North America (RSNA) 2014, Chicago, IL, Dec 2014 (accepted) |
Close