Multimodal Brain Tumor Segmentation Challenge 2017
 • Scope • Relevance • Tasks • Data • Data Request • Evaluation • Participation Summary • Previous BraTS • People •
Scope
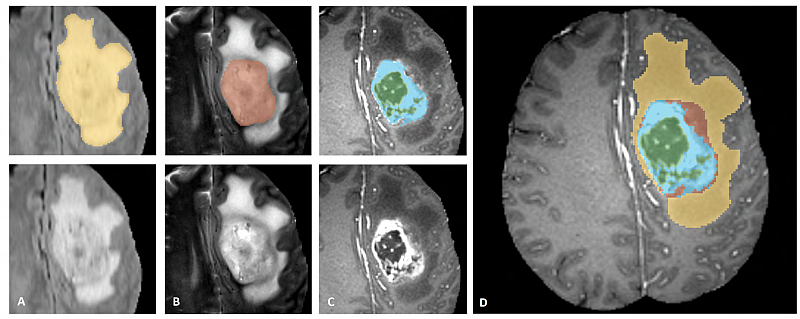
BraTS has always been focusing on the evaluation of state-of-the-art methods for the segmentation of brain tumors in magnetic resonance imaging (MRI) scans. BraTS 2017 utilizes multi-institutional pre-operative MRI scans and focuses on the segmentation of intrinsically heterogeneous (in appearance, shape, and histology) brain tumors, namely gliomas. Furthemore, this year, in order to pinpoint the clinical relevance of this segmentation task, BraTS’17 also focuses on the prediction of patient overall survival, via integrative analyses of radiomic features and machine learning algorithms.
| IMPORTANT DATES: 5 May 30 Jun Extended: 24 Jul Extended: 1-27 Aug 31 Aug 14 Sep 10 Nov |
Release of training data. — (Request the BraTS'17 data) Release of validation datasets. — (View the Leaderboard) Submission of short papers, reporting proposed method & preliminary results. Release of testing datasets (& performance evaluation). Contacting top performing methods for preparing slides for oral presentation. Challenge at MICCAI (Quebec City) - (View the pre-conference proceedings) Extended LNCS paper submission deadline. |
BraTS 2017 runs in conjunction with the MICCAI 2017 conference, on Sep.14, as part of the full-day BrainLes Workshop.
Feel free to send any communication related to the BraTS challenge in brats2017@cbica.upenn.edu