Current Research
Technique Development and Application to Craniofacial Imaging
The aim of this area of research is to develop solid-state MRI methods as a radiation-free alternative to CT for craniofacial imaging. Recent work in the laboratory demonstrates the method's feasibility in achieving this goal by significantly enhancing bone selectivity with soft-tissue suppression in clinically practical scan times. Ongoing work focuses on technical optimization of the method, comparison to CT imaging, and ultimately, translation to the clinic for examining children with craniofacial abnormalities pre- and postoperatively.
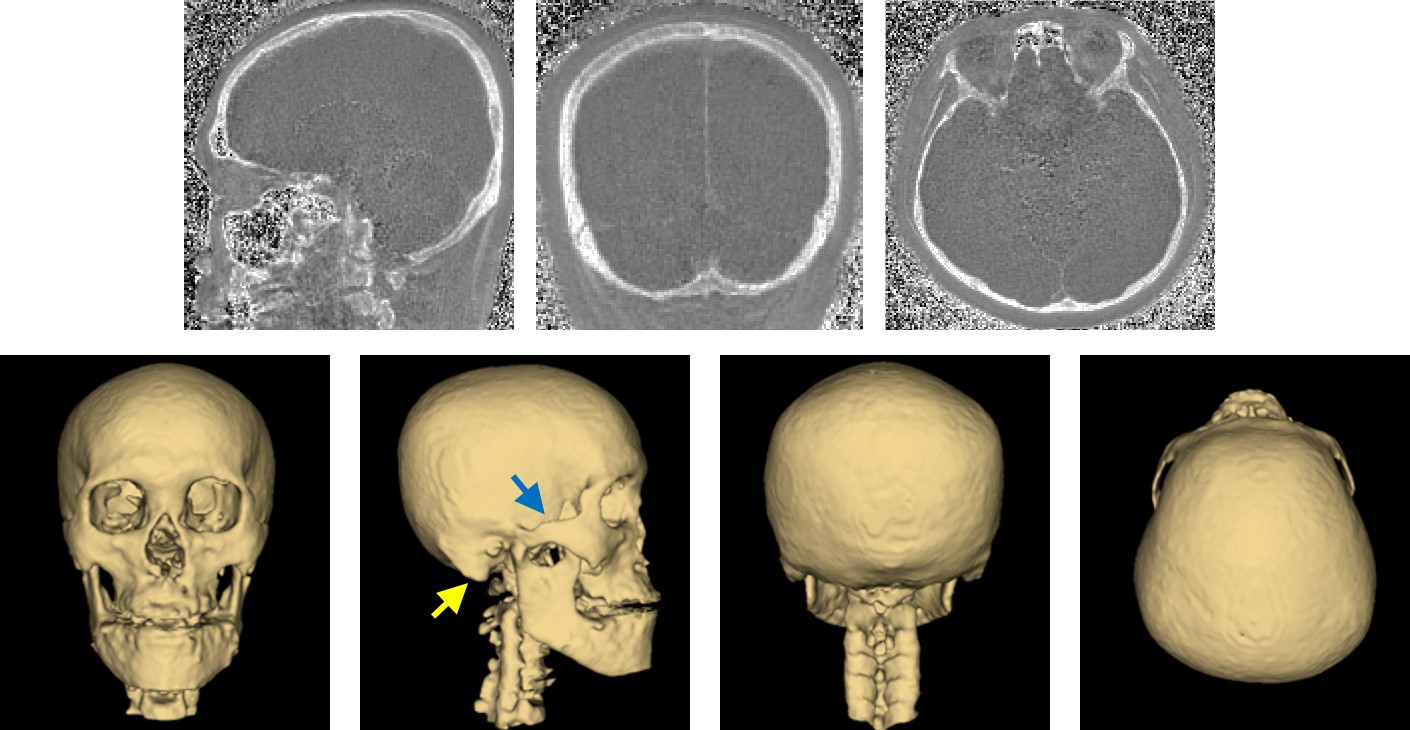
Top: Bone images of the whole-head in a subject, acquired and reconstructed using the proposed technique with prospective undersampling by a factor of four (imaging time = 3 min). Bottom: 3D renderings of the skull in the subject in anterior, lateral, posterior, and superior views. Note the expected anatomic structures such as mandible and upper portion of cervical spine. More subtle structures including zygomatic arch and mastoid process (blue and yellow arrows) are pointed out as well.
Reference: Lee H, Zhao X, Song HK, Zhang R, Bartlett S, Wehrli FW. Rapid Dual-RF, Dual-Echo, Three-Dimensional Ultrashort Echo Time Craniofacial Imaging: A Feasibility Study. Magn Reson Med. 81(5):3007-3016 (2019).
Solid-State 31P and 1H Imaging for Assessment of Bone Quality
In this project, MRI-based methods for quantifying cortical porosity and matrix and mineral density are investigated using proton and phosphorus MR imaging techniques. These techniques are currently being applied to study the response to intervention in patients clinically indicated for treatment of osteoporosis. These developments could potentially allow for a completely non-invasive examination of cortical bone microstructure and chemistry.
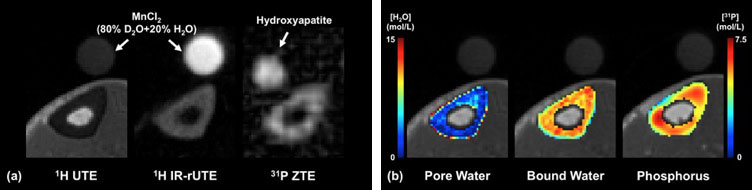
A) Example images of 1H UTE, 1H IR-rUTE and 31P ZTE sequences obtained at the mid-tibia of the same subject in the presence of density calibration samples (as indicated by arrows), from which, (B) color-encoded density maps of pore water (surrogate of bone porosity), bound water (surrogate of bone matrix density) and bone phosphorus (surrogate of bone mineral density) are derived.
Reference: Zhao X, Song HK, Seifert AC, Li C, Wehrli FW. Feasibility of Assessing Bone Matrix and Mineral Properties In Vivo by Combined Solid-State 1H and 31P MRI. PLoS ONE. 12(3):e0173995 (2017).
Quantitative BOLD (qBOLD)
This area of research aims to develop MRI methods that can provide maps of brain hemodynamic and metabolic properties in absolute physiologic units, and translate the techniques to the clinic. Recent technical advances made in this research area allow robust voxelwise quantification of venous cerebral blood volume (CBVv) and R2', both essential for generating 3D maps of oxygen saturation, not possible with previous methods. Target applications include the study of patients with steno-occlusive disease who are at risk of stroke.
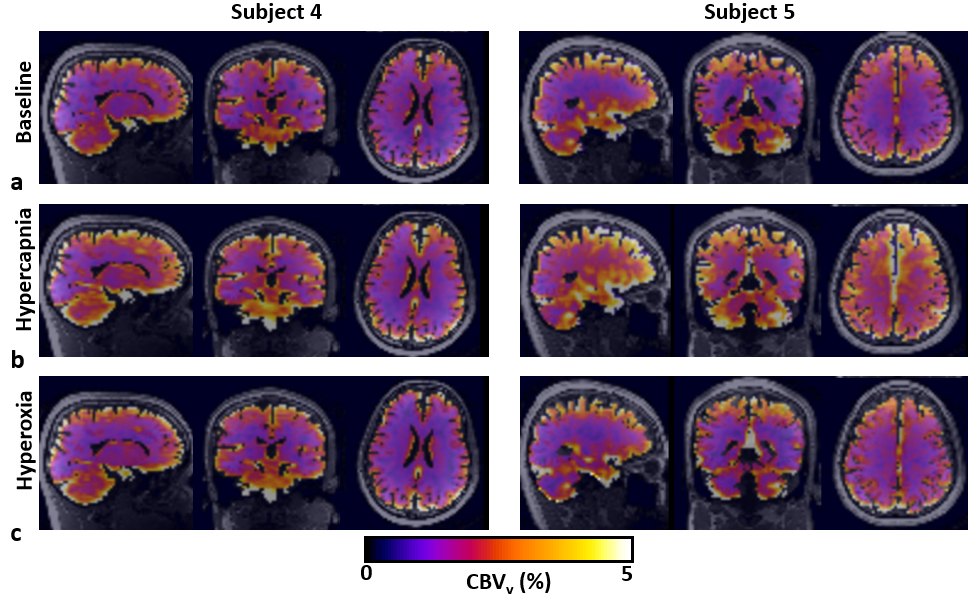
Maps of CBVv reformatted in the three orthogonal planes at baseline (A) and in response to hypercapnic (B) and hyperoxic (C) gas challenges, obtained using the proposed VS-VSL method in 2 study subjects (#4 and #5). Note the expected increase of CBVv during hypercapnia (B), whereas hyperoxia elicits no perceptible changes in CBVv.
Reference: Lee H, Wehrli FW. Venous Cerebral Blood Volume Mapping in the Whole Brain Using Venous-Spin-Labeled 3D Turbo Spin Echo. Magn Reson Med. 84(4): 1991-2003 (2020)
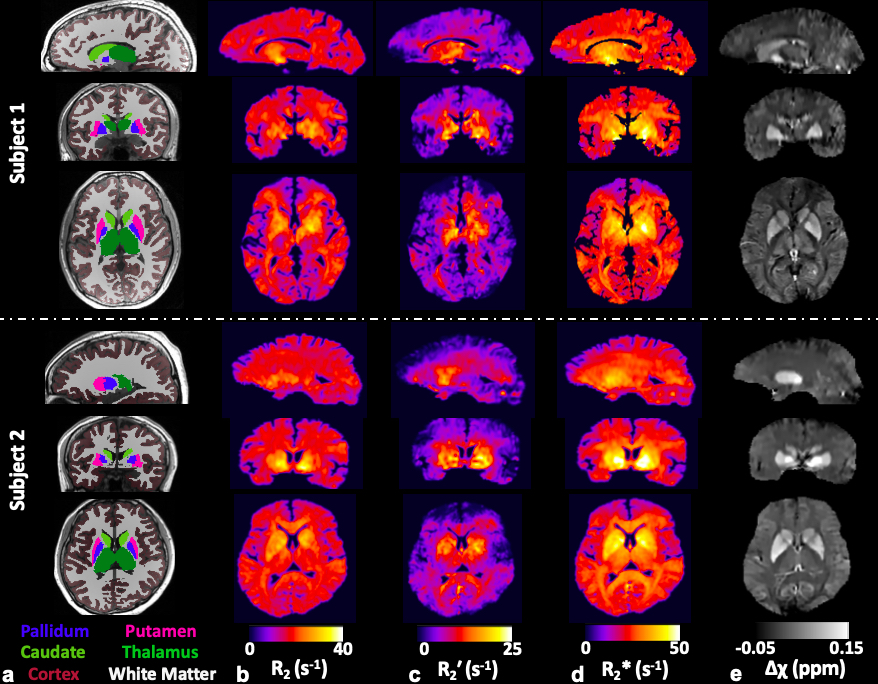
A) Color-coded regions of interest (ROIs) overlaid onto MPRAGE images. B-E, Whole-brain 3D maps of R2 (B), R'2 (C), R∗2 (D), and Δχ (E) in the three orthogonal planes in 2 study subjects (subjects 1 and 2), obtained using the proposed AUSFIDE pulse sequence (Figure 1) and data-processing steps (Figure 3). Note that all parametric maps depict expected contrast across brain territories (eg, cortical regions versus basal ganglia).
Reference: Lee H, Wehrli FW. Alternating Unbalanced Steady-State-Free-Precession for 3D R2′ Mapping of the Human Brain. Magn Reson Med. 2020 Dec 16. Epub ahead of print.
Technique Development (e.g. Multiplexing)
The lab’s dual-band OxFlow technique enables rapid quantification of whole-brain CMRO2 by means of signal multiplexing, and thus is a useful tool for studies seeking to estimate CMRO2 dynamics in response to a global stimulus. One target application we are currently seeking is to track sleep stage-dependent changes in neurometabolic parameters with concurrent EEG monitoring.
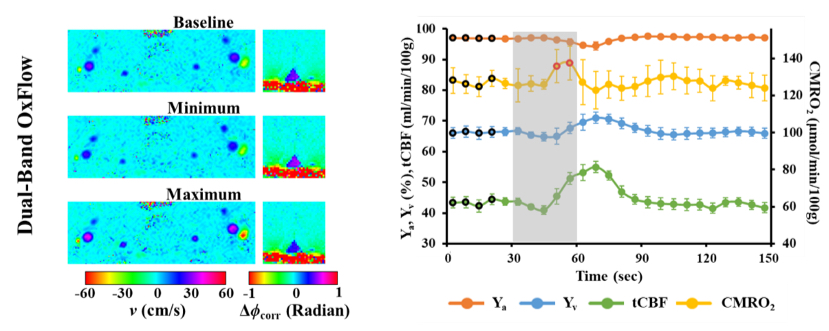
Yv, CBF, and CMRO2 in response to an apneic challenge using the dual-band OxFlow technique (temporal resolution = 6 sec). Left: a pair of v (neck) and ∆ (Phi) corr (brain) maps for baseline, minimum, and maximum of tCBF and Yv estimates, respectively. Right: group-averaged time-courses of the four physiologic quantities at baseline, volitional apnea (shaded area), and recovery periods.
Reference: Lee H, Langham MC, Rodriguez-Soto AE, Wehrli FW. Multiplexed MRI Methods for Rapid Estimation of Global Cerebral Metabolic Rate of Oxygen Consumption. NeuroImage. 149(1):393-403 (2017).
Applications in Obstructive Sleep Apnea
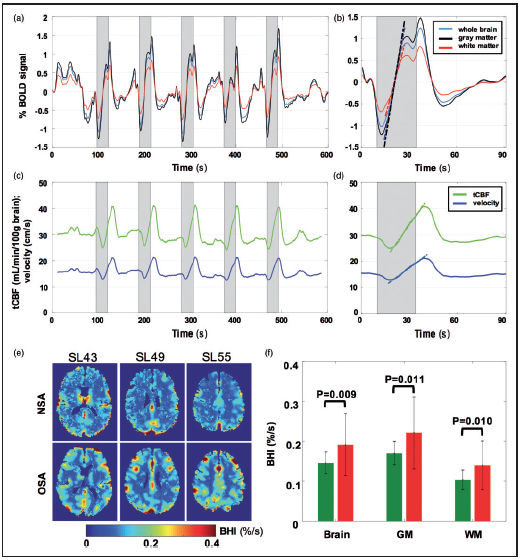
Temporal response to intermittent 24-s BH challenges in a patient with OSA (AHI = 28)and BOLD-derived BH indices. A) BOLD signal (%) averaged across the whole brain, gray matter and white matter; (C) tCFF)(mL/min/100g brain) and SSS flow velocity (cm/s). B,D) Temporal averages of time-course data in (A,C), with dashed lines representing calculated slopes yielding BHI. Shaded area represents apneic period. BHI maps derived from BOLD for three imaging slices from the same OSA patient and a representative NSA subject. F) BHI for OSA subjects (red) and NSA reference subjects (green) pertaining to whole brain, GM, and WM. Greater BH indices in OSA were significant in all three brain regions.
Reference: Wu PH, Rodríguez-Soto AE, Rodgers ZB, Englund EK, Wiemken A, Langham MC, Detre JA, Schwab RJ, Guo W, Wehrli FW. MRI Evaluation of Cerebrovascular Reactivity in Obstructive Sleep Apnea. J Cereb Blood Flow Metab. 40(6):1328-1337 (2020)
CMRO2 Measurement During States of Reduced Consciousness
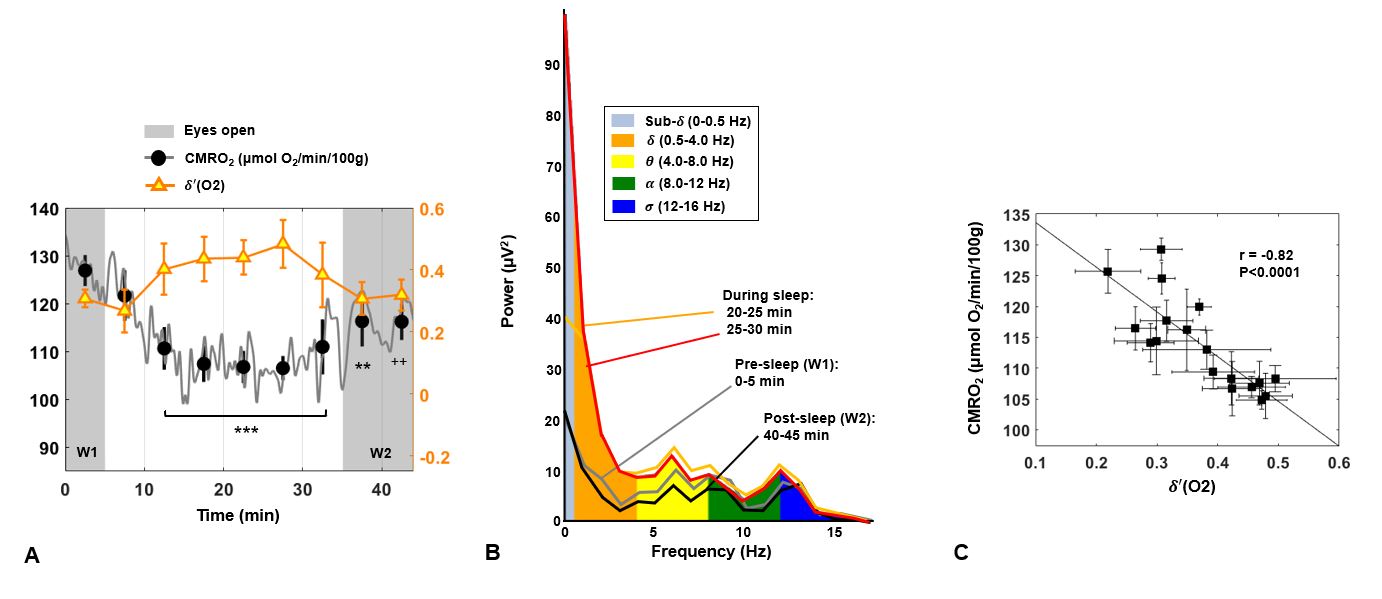
CMRO2 and temporal evolution of δ -power. A) Power spectral density ratio δ’ recorded by the O2 channel, superimposed on CMRO2 time-course for a subject with onset of sleep occurring in the central portion of the protocol (S01 M, 40 years). Shaded regions represent the periods of alert wakefulness (W1 and W2). Average values over 5-min time windows are depicted, together with the standard deviation (SD). For each 5-min interval, CMRO2 is compared with the pre-sleep average, reaching a maximum relative decrease of 16% in this subject (++P<0.005; **P=0.001; ***P<0.0001). B) EEG power bands recorded by the cortex electrode O2 during the EEG+rOxFlow protocol for the same subject. The data show increased low-frequency components (sub-δ, δ, θ
 ) between 20 and 30 min, and decreased α
 -activity during W1 and W2 (0–5 min and 40–45 min, respectively). C) Correlation between CMRO2 and δ-power ratio (δ’(O2)), in the same subject. Markers represent average values over 2.5 min successive time windows, with error bars indicating SD.
Reference: Caporale A, Lee H, Lei H, Rao H, Langham MC, Detre JA, Wu PH, Wehrli FW. Cerebral metabolic rate of oxygen during transition from wakefulness to sleep measured with high temporal resolution OxFlow MRI with concurrent EEG. J Cereb Blood Flow Metab. (2020)
DCE-MRI
The focus of this research is the development of dynamic contrast-enhanced (DCE-) MRI techniques based on radial data acquisition and reconstruction that allow ultra-rapid dynamic imaging at both high spatial and high temporal resolutions. This acquisition strategy also permits highly effective methods for motion compensation to account for respiratory and other types of physiologic motion. These strategies have been utilized for the characterization and assessment of treatment effects in various tumors, including lung, liver, pancreas, and breast.
A) Standard cartesian DCE-MRI time series. Notice the changes in shape and position of the lung lesion with respiration; B) golden angle radial acquisition with retrospective gating. The lesion now appears stationary with retrospective gating, making accurate tumor perfusion analysis possible.
Reference: Lin W, Guo J, Rosen MA, Song HL. Respiratory Motion-Compensated Radial Dynamic Contrast-Enhanced (DCE)-MRI of Chest and Abdominal Lesions. Magn Reson Med. 60:1135-1146 (2008).
Bone Metabolism and Cancer
Standard of care bone disease management approaches based on bone density tests for patients suffering from osteoporosis and bone fracture risk, often an elevated risk in patients diagnosed with metastatic cancer or malignancies, such as multiple myeloma, cannot measure the amount of bone turnover or metabolism. Yes, these very characteristics are those which explain discrepancies between bone density measurements and fracture risk in cadaveric studies. As no reliable method is currently capable of predicting the best treatment for a given patient, or even for assessing treatment efficacy early enough to predict depth or duration of a response allowing changes in treatment to improve outcomes, we are investigating the benefit of personalized treatment decisions using a novel imaging tool based on dual-tracer PET in conjunction with CT or MRI.
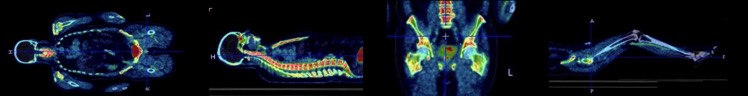
18F-sodium fluoride (NaF) PET/CT bone images of a subject showing the tracer uptake in the upper body, spine, hip, and lower skeleton.
Cardiovascular Disease
Most individuals with atherosclerosis, a disease in which plaque builds up inside the arteries, will never experience clinical symptoms. As a result, over half of those who die suddenly duo to coronary heart disease go undiagnosed prior to death. We are investigating new approaches for atherosclerosis imaging via a multimodality approach, utilizing 18F-sodium fluoride (NaF) and 18F-fluorodeoxyglucose (FDG) PET as molecular imaging probes, in combination with structural imaging methods such as MRI and CT.
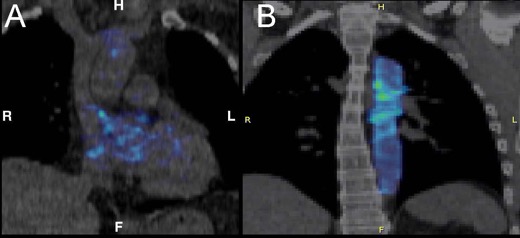
NaF PET/CT images showing calcified plaque in the (A) coronary arteries and (B) aorta.
Reference: Sorci O, Batzdorf AS, Mayer M, Rhodes S, Peng M, Jankelovits AR, Hornyak JN, Gerke O, Høilund-Carlsen PF, Alavi A, Rajapakse CS. 18F-Sodium Fluoride PET/CT Provides Prognostic Clarity Compared to Calcium and Framingham Risk Scoring When Addressing Whole-Heart Arterial Calcification. Eur J Nucl Med Mol Imaging. 47(7):1678-1687 (2020).
3D Bio-Printing for Personalized Orthopaedic Applications
Critical size bone defects are orthotopic defects that will not completely heal over the natural lifetime of an individual without medical intervention that can result from a variety of disease related or congenital causes. Improper resolution of these defects can lead to bone nonunion thereby compromising the strength and mobility of the skeletal system, while causing pain and decreasing the quality of life for affected individuals. Fixation of these lesions frequently involves surgical excision of large areas of bone, sometimes from important load bearing structures such as the femoral shaft. While autologous grafting is thought to provide the best osteoinductive, osteoconductive, and osteogenic properties while significantly reducing the risk of rejection from the patient’s immune system, the method is limited by size, donor site concerns, and a potential critical size defect at the donation site itself. Grafts that can mimic patient-specific bone geometry at the macro level to provide a precise fit, include a favorable microstructure as it exists in a healthy person to facilitate further bone growth, and interface with the existing vasculature in the surrounding areas are critical to the development of a reliable, safe repair technique that can mimic or improve healthy natural bone strength and function.
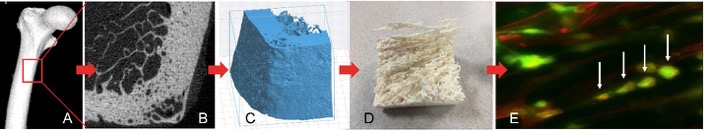
A) High resolution CT and MRI allows imaging of (B) bone microstructure at sites such as the proximal femur. C) These images can be used to generate patient-specific 3D models of bone. D) Recent developments in 3D printing using biocompatible materials permit the use of image-based 3D models to fabricate bone scaffolds. E) These scaffolds can be further improved through mesenchymal stem cell engraftment, paving the way for highly personalized bone grafts or other orthopaedic implants.
Automated 3D Model Creation from Medical Devices for Augmented Reality Purposes
Utilizing CT or MRI scans, we are developing different scripts that allow for the automated creation of 3D models of bones, organs and other structures to be used with existing augmented reality headsets such as the Microsoft HoloLens. This technology paves the way for a new era of medical imaging based surgical planning.
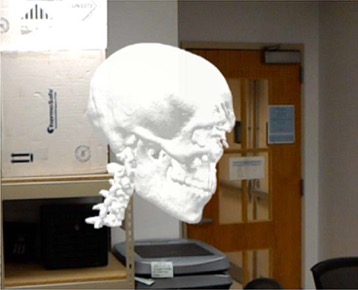
Mixed reality scene automatically generated from a patient’s CT scan to be used in Microsoft HoloLenz
Development of Artificial Intelligence for Medical Imaging
With recent advancements in image analysis using deep learning and neural networks, the automated analysis of radiological images such as x-rays have become a possibility. In the lab, we are currently building and training a convoluted neural network for medical image analysis.
Development of a Light-Weight Scalable Electronic Medical Record System
With the increasing need for developing nations to maximize use of their existing medical infrastructures to support growing populations, the use of electronic medical record systems has become paramount. However, the exponential cost and infrastructure necessary to adopt and run a system using standards employed by developed nations has proven to be a constant hurdle. We are investigating the development of a peer-to-peer system that does not require localized servers that can run on the simplest of devices to quickly extend coverage across a given nation. The system is modular, and could utilize blockchain technology to help improve security and scalability.
Development of Artificial Intelligence for the Workflow Optimization of Electronic Medical Record Systems
Resource management is essential for effective healthcare delivery. With ever increasing populations and the slow growth of medical infrastructure, the need for effective and predicative resource management is of absolute necessity. We are working toward developing algorithms and neural networks to effectively manage hospital resources (e.g. laboratory use, diagnostic test requesting, patient occupancy) in an attempt to provide greater access to more patients using the same infrastructure. This includes the development of artificial intelligence models for predicative care and basic patient data analysis.
Reference: Pending
Study of Bone Architecture and Mechanics
A core activity of the lab is on development and translation of image-based assessment of trabecular and cortical bone structure, changes of which during ageing and hormone depletion have been implicated as key determinants in osteoporotic fracture risk. Methods developed and being refined focus on high-resolution 3D image acquisition and processing as a means to establish accurate models of the bone’s architecture. These, in turn, then serve as input into a finite-element (FE) solver yielding mechanical constants such as stiffness and failure load. Recent algorithmic developments in the lab now allow large-scale simulations with tens of millions of finite elements in both linear and nonlinear regimes. The methodology is currently applied to two large studies aimed at evaluating bone strength in patients at risk of fracture and in a trial of early postmenopausal women undergoing experimental intervention with low-magnitude mechanical stimulation.
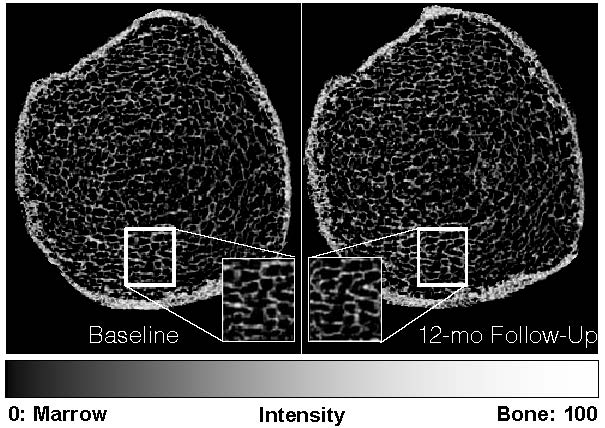
MRI-derived bone volume fraction maps of the distal tibia of a representative participant taken 12 months apart show the ability to capture matching bone microstructure using prospective registration. Regions are magnified to demonstrate matched pairs. These 3D maps serve as input into the finite-element model, yielding a measure of stiffness in GPa and thus strength.
Cortical Nanostructure and Chemistry
At the core of this project is the study of cortical bone, which plays a pivotal role as a transport and signaling medium as well as for load transfer. This project involves the development of radial imaging strategies with T2-selective soft-tissue suppression pulses as a means to separate the functionally and structurally different pore and collagen-associated water fractions. In recent work the two fractions have been uniquely identified on the basis of deuterium NMR. Other elements of the project focus on the development of solid-state scanning techniques for quantifying mineral phosphorus with goal of creating an integrated examination that would distinguish osteomalacia from osteoporosis.
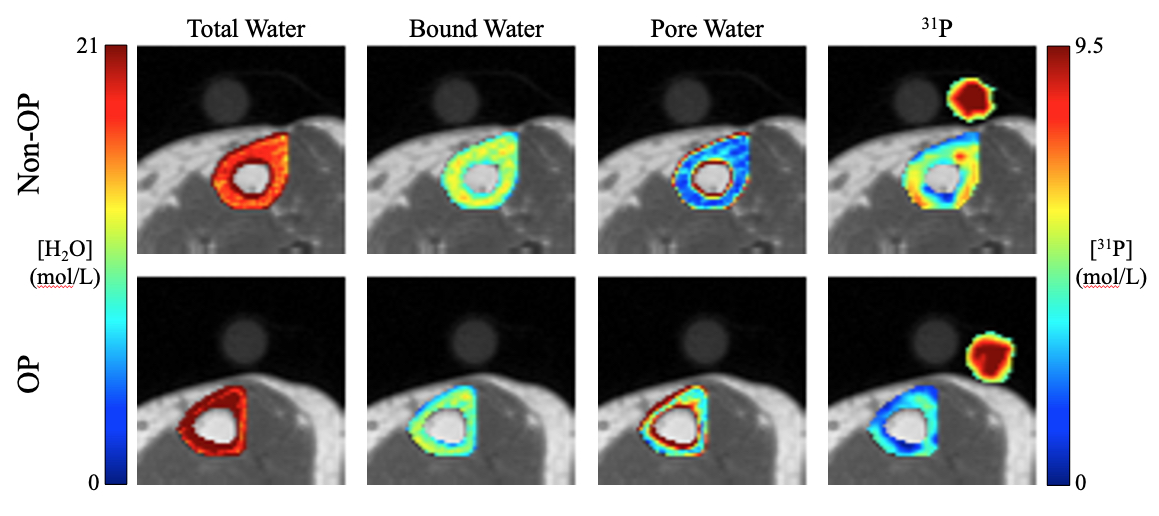
Diagram of preliminary in vivo results for comprehensive cortical bone assessment through solid-state imaging of phosphorus and through bone water quantification using T2-selective pulse sequences to differentiate between pore and collagen-associated (bound) water pools. Scans were performed at the tibia in two postmenopausal women as part of an ongoing translational research study. Concentration colormaps are compared between a treatment-naïve osteoporotic (OP) and a non-osteoporotic (Non-OP) participant. As expected, the non-osteoporotic participant has higher bound water, indicating greater collagen density, higher pore water, indicating large pore spaces in cortical bone, and higher phosphorus content, indicating greater mineral density (excerpted from Jones, B. ISMRM 2020).
Reference: Rajapakse CS, Johncola AJ, Batzdorf AS, Jones BC, Al Mukaddam M, Sexton K, Shults J, Leonard MB, Snyder PJ, Wehrli FW. Effect of Low-Intensity Vibration on Bone Strength, Microstructure, and Adiposity in Pre-Osteoporotic Postmenopausal Women: A Randomized Placebo-Controlled Trial. J Bone Miner Res. 2020 Dec 13. Epub ahead of print.
MRI-Based Computational Biomechanics
This area of investigation aims to further improve, validate, and translate to the clinic, a high-resolution MRI-based computational biomechanics framework for hip fracture risk assessment in patients with various degrees of age-related microstructural and mechanical deficiencies of bone. With this computational approach toward improving current standard-of-care tests utilized to diagnose and manage metabolic bone diseases, we aim to achieve the capability to assess biomechanical strength in the proximal femur. A further area of focus, particularly in the setting of osteoporosis, is on development of a novel MRI-based assessment test of the proximal femur’s microarchitecture and strength - beyond current diagnostic methods such as DXA and FRAX - to identify skeletally fragile glucocorticoid-users needing therapy while differentiating bone fracture and non-fracture populations on the basis of high resolution MRI and biomechanics of the femoral neck.
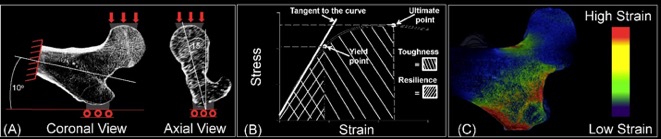
A) Three-dimensional modeling of the proximal femur and simulation of loading conditions during a fall onto the hip in a human subject. B) Estimation of bone stiffness, strength, toughness, and resilience. C) Spatial distribution strain on bone during a fall onto the hip.
Reference: Rajapakse CS, Hotca A, Newman BT, Ramme A, Vira S, Kobe EA, Miller R, Honig S, Chang G. Patient-specific Hip Fracture Strength Assessment with Microstructural MR Imaging-based Finite Element Modeling. Radiology. 283(3):854-861 (2017).
Impaired endothelial function or endothelial dysfunction (EDF) implies reduced bioavailability of nitric oxide, which is synthesized by endothelial cells, and can result in detrimental structural and mechanical remodeling that ultimately impairs the vascular reactivity of the arteries. EDF is a systemic disorder thus the new imaging methods must be capable of quantify a spectrum of physiologic parameters across multiple vascular beds, including central and peripheral conduit arteries, within a single scan session. Toward this goal, we have developed and reduced to practice of new quantitative MRI methods into a single examination protocol. The qMRI protocol comprises dynamic venous oximetry , time-resolved arterial velocimetry, measurement of flow-mediated dilation based on rapid vessel-wall imaging and real-time central and peripheral pulse-wave velocity quantifications.
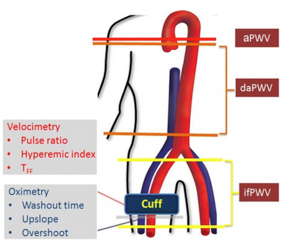
Schematic of imaging protocol and parameters quantified, comprising measurement of vascular reactivity via arterial velocimetry and venous oximetry at rest and hyperemia and estimation of PWV for the three arterial segments indicated: aPWV=ascending aorta PWV, daPWV=descending aorta PWV in the thoracoabdominal segment, ifPWV=iliofemoral PWV
Reference: Langham MC, Wehrli FW. Simultaneous Mapping of Temporally-Resolved Blood Flow Velocity and Oxygenation in Femoral Artery and Vein During Reactive Hyperemia. J Cardiovasc Magn Reson. 13(1):66 (2011).
Assessment of Peripheral Vascular Reactivity with Dynamic Venous Oximetry and Arterial Velocimetry
Dynamic oximetry and velocimetry were developed to quantify reactive hyperemia in the lower extremity in response to a 5 min cuff-induced ischemia. Only one cuff paradigm is needed to assess micro- and macrovascular function of the peripheral vascular territory by merging the methods as a multi-echo GRE pulse sequence that samples velocity-encoded projections (velocimetry) and full-image echoes for field mapping (MR susceptometric oximetry). In dynamic oximetry blood in the capillary bed serves as an endogenous tracer that is “tagged” via oxygen extraction during the suspension of arterial resupply via cuff-occlusion. Upon cuff release or restoration of arterial flow, the kinetics of the oxygen-depleted blood in the capillary bed and its subsequent replacement by normally oxygenated venous blood is then temporally resolved at the imaging location every 1.25 s. The blood flow velocity in the femoral artery is quantified simultaneously with the velocity-encoded projections to characterize hyperemia.
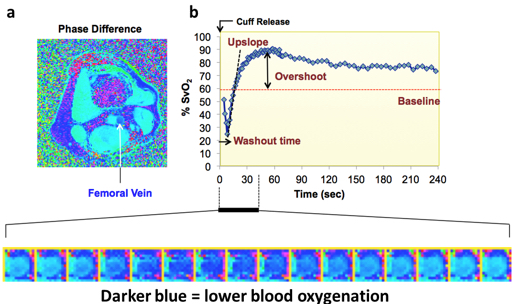
Dynamic oximetry. A) Representative field map shows greater induced magnetic field in the femoral vein (dark blue) relative to the surrounding muscle tissue and arterial blood as a result of higher fraction of deoxygenated hemoglobin. B) Time-course of SvO2 in femoral vein is parameterized by washout time, upslope and overshoot (cuff release at t=0). Bottom panel shows magnified view of femoral vein during early phase hyperemia.
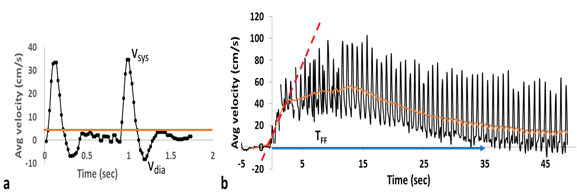
Hemodynamic evaluation of femoral artery. A) Baseline blood flow velocity (average velocity denoted by the horizontal line) in a healthy 28-year-old nulliparous female. B) Blood flow velocity in femoral artery resolved at a temporal resolution of 120ms following cuff release (at t=0). Monophasic (forward flowing only) velocity waveform indicate significant decrease in the peripheral vascular resistance; parameterized by the duration of forward flow (TFF) and the hyperemic index (HI). The peak value of 3s sliding-window average of velocity (orange line) divided by the baseline average velocity (A) gives the peripheral flow reserve, PFR.
Reference: Englund EK, Langham MC. Quantitative and Dynamic MRI Measures of Peripheral Vascular Function. Front Physiol. 11:120 (2020).
Superficial Femoral Artery Luminal Flow-Medicated Dilation (FMD)
In addition to assessment of vessel-wall morphology, a rapid black-blood technique has the potential to quantify FMD, a surrogate marker of endothelial function, in peripheral arteries in response to a challenge, e.g. arterial occlusion. Conventional Duplex US brachial FMD analysis is performed 60s after cuff release and images the artery in the sagittal plane to estimate the change in the diameter. It is preferable to image the artery in the axial plane at three time-points because the luminal FMD (change in the lumen area) yield greater detection sensitivity and the peak dilation time is subject dependent (Langham et al, ISMRM 2018).
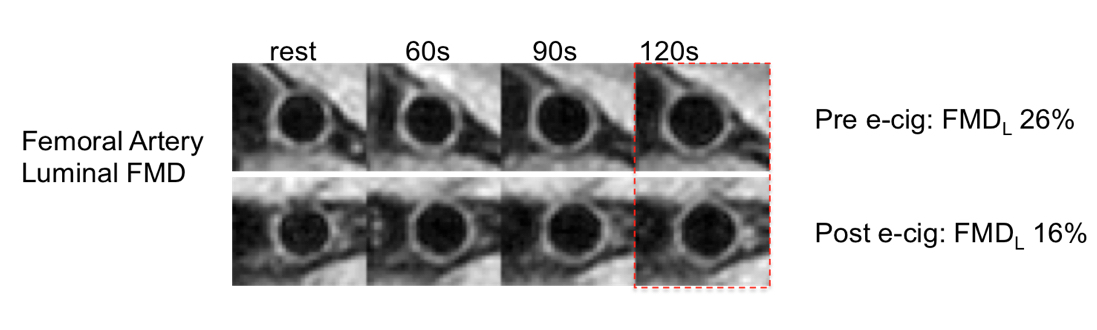 Vessel-wall images of the superficial femoral artery of a nicotine-naïve healthy young female before (top row) and after (bottom row) an acute nicotine-free e-cigarette challenge at three time points during hyperemia. The decrease in FMD after the e-cig challenge indicates that inhalation of aerosol generated by the e-cig impairs endothelial function.
Reference: Langham MC, Li C, Englund EK, Chirico EN, Mohler ER 3rd, Floyd TF, Wehrli FW. Vessel-Wall Imaging and Quantification of Flow-Mediated Dilation Using Water-Selective 3D SSFP-Echo. J Cardiovasc Magn Reson. 15(1):100 (2013).
E-Cigarette Acute Effects
The popularity of electronic cigarettes (e-cigs) has grown at a startling rate since their introduction to the US market 10 years ago, with sales expected to outpace tobacco products within a decade. E-cigs are often perceived as a safer alternative to tobacco-based cigarettes, which is unsettling given the limited science on its chemistry and paucity of knowledge on long-term health effects of aerosol inhalation. Particularly alarming is marketing directed extensively toward adolescents, which indicates that young people are the key target market of e-cig companies.
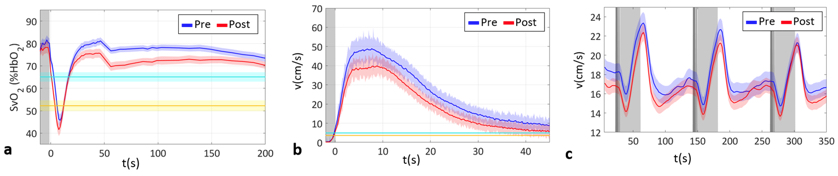
Acute effects on peripheral and neurovascular reactivity before (pre) and after (post) e-cig aerosol inhalation in young non-smokers (N=27, 11 females, age 24±4.4 yrs). Solid lines represent population average, shaded areas indicate the standard error of the mean (SEM) for SvO2 in femoral vein (A), velocity in femoral artery (B) and in the superior sagittal sinus (C). SvO2 time-course and baseline levels are shown respectively in blue and light blue for pre, and in red and yellow for post in (A).
Building on recent work in the investigators’ laboratory in which surrogate measures of EDF were quantified in tobacco cigarette smokers, we are examining both the acute and long-term effects of e-cig aerosol inhalation by quantitative MRI as described above. The goal of the project is to investigate the hypothesis that the oxidative stress exerted by nicotine-free e-cig aerosol causes EDF comparable to that from cigarette smoke exposure and that MRI-derived biomarkers parallel inflammatory indices measured in serum. Preliminary data in healthy non-smokers indicate that the acute effects of e-cig aerosol inhalation are detectable by qMRI. Although many of our findings are highly statistically significant, corroboration of these observations in larger cohorts are indicated. While transient in nature, repeated vaping in brief intervals, is likely to cause permanent impairment of vascular tone.
Reference: Caporale A, Langham MC, Guo W, Johncola A, Chatterjee S, Wehrli FW. Acute Effects of Electronic Cigarette Aerosol Inhalation on Vascular Function Detected at Quantitative MRI. Radiology. 293(1):97-106 (2019).
Study of Impaired Vascular Reactivity in Women after Preeclamptic Pregnancy
A large body of evidence suggests maternal EDF has a central role in the development of preeclampsia, the most serious hypertensive pregnancy disorder that significantly increases risk for future cardiovascular diseases. Because pathophysiology of preeclampsia remains within 72 hrs of delivery of the placenta, the quantification of surrogate MRI markers of EDF was performed after birth in women with and without hypertensive pregnancy to test the hypothesis that EDF is associated with preeclampsia.
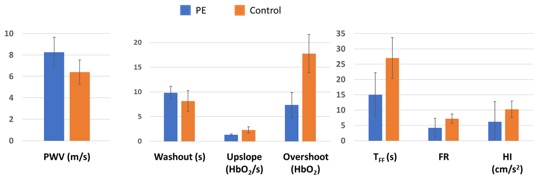
Trend of impaired vascular reactivity detected by qMRI after preeclamptic pregnancy. The relative differences of the MR metrics of vascular reactivity ranged from 20% (washout) to 55% (overshoot) between the two cohorts. At this stage of the pilot study statistical test was not performed due to a limited sample size. The average values of the MRI markers of EDF parameters in the control group (normotensive pregnancy) within 78 hrs of delivery are comparable to those previously measured in young healthy group that included both sexes and whose age ranged between 18 to 35 yrs. Whiskers represent standard deviation.
The preliminary data suggests that qMRI can detect negative effects of preeclamptic pregnancy on vascular reactivity but a larger cohort size is needed for a more comprehensive investigation. Studies that examine maternal vascular reactivity associated with the profound cardiovascular system adaptations at 2nd and 3rd trimesters are also warranted to better understand the normal changes in the during pregnancy. Lastly, because there is little information available on women before their preeclamptic pregnancy, the observed EDF in the present pilot study does not imply that PE causes EDF.
Reference: Langham MC, Caporale AS, Wehrli FW, Parry S, Schwartz N. Evaluation of Vascular Reactivity of Maternal Vascular Adaptations of Pregnancy With Quantitative MRI: Pilot Study. J Magn Reson Imaging. 25:e27342 (2020).
The stiffness of the central artery is assessed in terms of aortic arch pulse-wave velocity (PWV), which represents the rate at which the blood motion is transmitted to downstream locations. For example, in a rigid vessel PWV approaches infinite because proximal pressure increase will displace all blood (incompressible) at the same time. Thus, instantaneous transmission of the motion would result in no phase shift between the velocity waveforms at two locations. In our method, a novel non-gated 1D technique to quantify both central and peripheral PWV (proximal and distal aorta, iliac arteries, and femoral/popliteal arteries) to provide localized compliance not limited to the aorta. The 1D method yields PWV of the aortic arch, descending aorta, as well as the segment extending from abdominal aorta to femoral arteries and femoral to popliteal arteries, bilaterally. In this manner, gating errors are eliminated compared to conventional MRI methods and velocity waveforms over multiple heartbeats can be acquired in real-time. The time-resolved “velocity” waveforms are plotted jointly to determine the transit time via the “foot-to-foot” method as routinely performed in tonometry.
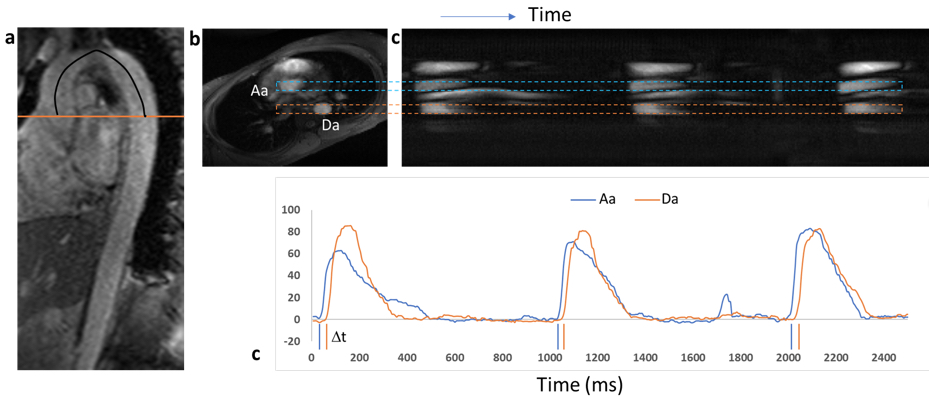
Non-cardiac triggered aortic PWV quantification. A) Oblique sagittal image of the aorta used for estimating the path length L (black line) of the pressure wave. Orange line indicates the slice position of the (B) reference axial image, where ascending and descending aorta are identified. The image is rotated (readout direction is oriented vertically) to help identify the vessels of interest on signal intensity (proportional to velocity) image of (C) as denoted by the dashed rectangles. D) Time-course of velocity-dependent signal intensity generated from c) clearly show transit delay of velocity wave at descending aorta (Da) relative to ascending aorta (Aa). Dt is the transit time of the pressure or velocity wave from Aa to Da. PWV is computed as L/Dt.
Reference: Langham MC, Li C, Wehrli FW. Non-Triggered Quantification of Central and Peripheral Pulse-Wave Velocity. J Cardiovasc Magn Reson. Dec 21;13(1):81 (2011).
Calibration of T2 vs. HbO2
Adequate oxygen delivery is critical for normal fetal development. To date, nearly all MRI investigations of placental oxygenation have been based on qualitative imaging (e.g. BOLD) and non-physiological parameters (e.g. T2*).
T2-based MR oximetry involves quantitative mapping the decay of the transient MR signal as blood water protons are subjected to a train of refocusing pulses and a subsequent analysis by a parameterized form of the Luz-Meiboom model, 1T2=1T2o+K(1-HbO2)2 , where T2o is the transverse relaxation time of fully oxygenated blood, and K is the relaxivity, a constant governed by T2-preparation, field strength and acquisition scheme, and HbO2 is the hemoglobin saturation fraction. The derivation of the calibration curve amounts to determining T2o and K that allows estimation of HbO2 from blood T2 quantification.
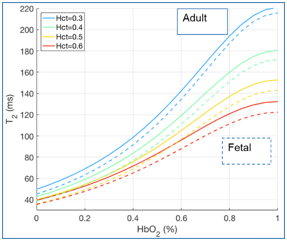
Calibration curve to convert intravascular blood T2 to HbO2. Experiments were performed on both adult blood and fetal cord blood to account for the differences in Hgb type.
Reference: Langham MC, Rodríguez-Soto AE, Schwartz N, Wehrli FW. In vivo whole-blood T2 versus HbO2 Calibration by Modulating Blood Oxygenation Level in the Femoral Vein Through Intermittent Cuff Occlusion. Magn Reson Med. 79(4):2290-2296 (2018).
T2-bSSFP with Background Suppression (BGS)
For umbilical vein it is not possible to prescribe the imaging slice perpendicular to minimize the partial volume effect (PVE), which is a significant source of error in T2-based oximetry. Higher spatial resolution will reduce PVE but incurs high SNR penalty. In the T2-prep module BGS is implemented to allow for larger voxel size to enhance SNR while minimizing PVE.
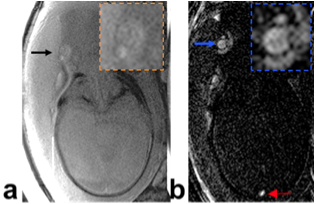
Intravascular T2 quantification with BGS (insets show magnified view). A) Arrow points to umbilical vein. The estimated T2 is 300ms and cannot yield physiologically plausible HbO2. PVE in the presence of Wharton’s jelly (T2~750ms) and amniotic fluid (T2~2s) is the likely source of T2 overestimation. B) With BGS the umbilical vein (blue arrow) is well visualized, yielding a more plausible T2 (102ms, Hct=0.6 or 70%HbO2). Further, fetal superior sagittal sinus can also be visualized (red arrow).
Reference: Rodríguez-Soto AE, Abdulmalik O, Langham MC, Schwartz N, Lee H, Wehrli FW. T2 -Prepared Balanced Steady-State Free Precession (bSSFP) for Quantifying Whole-Blood Oxygen Saturation at 1.5T. Magn Reson Med. 79(4):1893-1900 (2018).
Achieving CT and MRI Super Resolution using Deep Learning
Text to be added.
Highly Accelerated MRI using Diffusion Deep Learning
Text to be added.
Automatic Abnormality Detecting on Medical Images using AI
Text to be added.
Segment Anything in 3D (SAM3D) Model for Medical Images
Text to be added.