2025 Post-Graduate Outcomes
2025 Graduating Specialty Outcomes
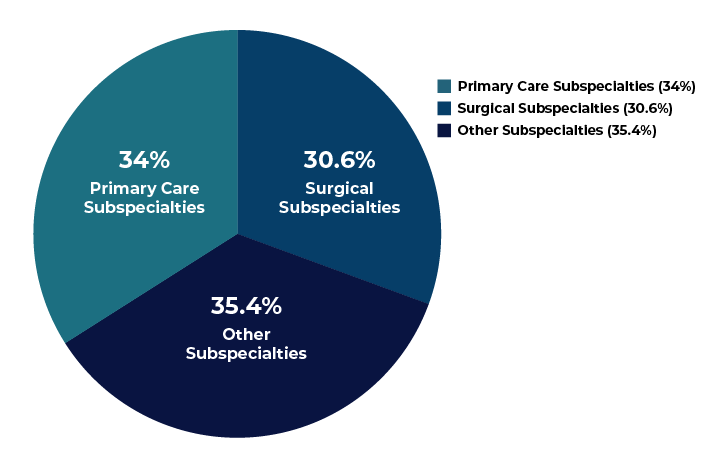
| Specialties | Percentage |
|---|---|
| Primary Care Subspecialties | 34% |
| Surgical Subspecialties | 30.6% |
| Other Subspecialties | 35.4% |
| Major Primary Care Subspecialties | |
|---|---|
| Internal Medicine | 25% |
| Pediatrics | 4.9% |
| Family Medicine | 3.5% |
| Internal Medicine/Pediatrics | 0.7% |
| Total Major Primary Care Subspecialties |
34% |
| Surgical Subspecialties | |
|---|---|
| Ophthalmology | 4.9% |
| Pathology-Anatomic and Clinical | 4.2% |
| Plastic Surgery (Integrated) | 4.2% |
| Dermatology | 3.5% |
| Obstetrics and Gynecology | 3.5% |
| Orthopaedic Surgery | 3.5% |
| Neurological Surgery | 2.8% |
| Urology | 2.1% |
| Otolaryngology | 1.4% |
| Vascular Surgery (Integrated) | 0.7% |
| Total Surgical Subspecialties | 30.6% |
| Other Subspecialties | |
|---|---|
| Psychiatry | 7.6% |
| Emergency Medicine | 6.3% |
| Anesthesiology | 4.9% |
| Radiology-Diagnostic | 4.2% |
| Neurology |
2.8% |
| Interventional Radiology (Integrated) | 2.1% |
| Child Neurology | 1.4% |
| Physical Medicine and Rehabilitation | 1.4% |
| Surgery-General | 1.4% |
| Thoracic Surgery (Integrated) | 1.4% |
| Pediatrics/Anesthesiology | 0.7% |
| Pediatrics/Medical Genetics | 0.7% |
| Radiation Oncology | 0.7% |
| Total Other Subspecialties | 35.4% |
*Excludes OMF and non-clinical residency